A bit of corporate 3D print company analysis today.
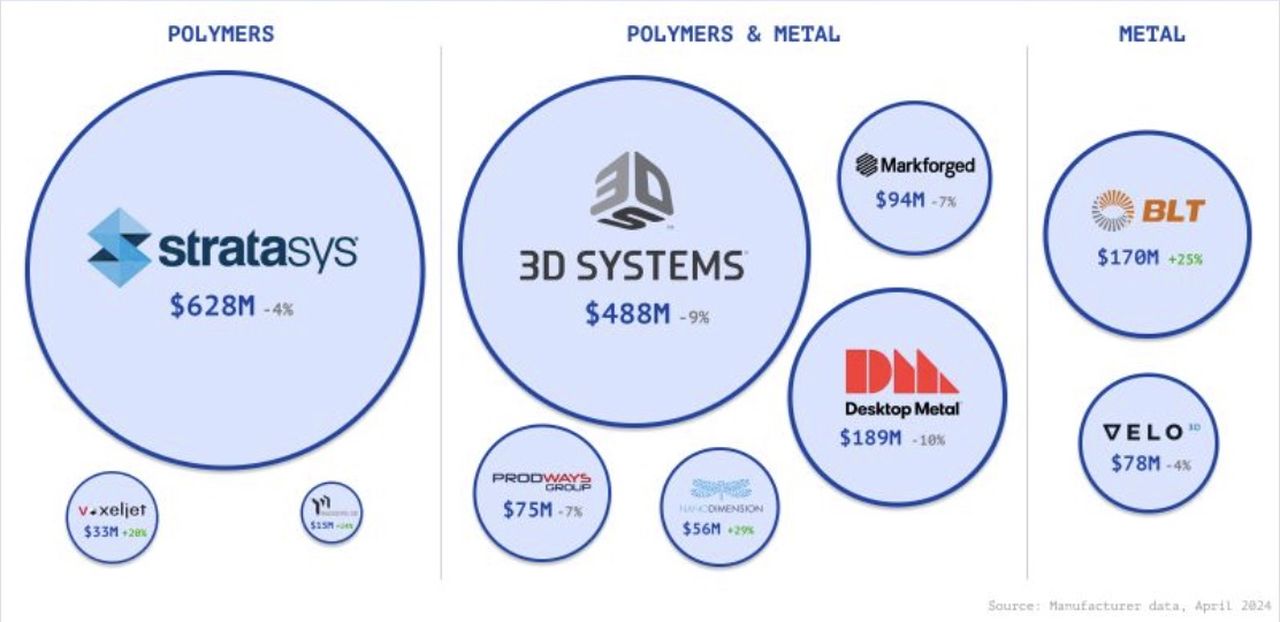
Martin Lansard of Aniwaa posted an interesting chart of publicly traded 3D print company revenues on LinkedIn, shown here:

The chart shows the major players and their relative revenue sizes. However, revenue is only half of the equation. Are any of these companies making any money? Do they cut a profit on their operations?
That was the question many in the discussion were concerned with, so I decided to do some analysis on my own.
Fabbaloo readers know that each Sunday we publish our leaderboard of publicly traded companies that have significant work in 3D printing. The leaderboard now has 18 companies on the list, but many of them are quite small. Over the past couple of years many have even disappeared.
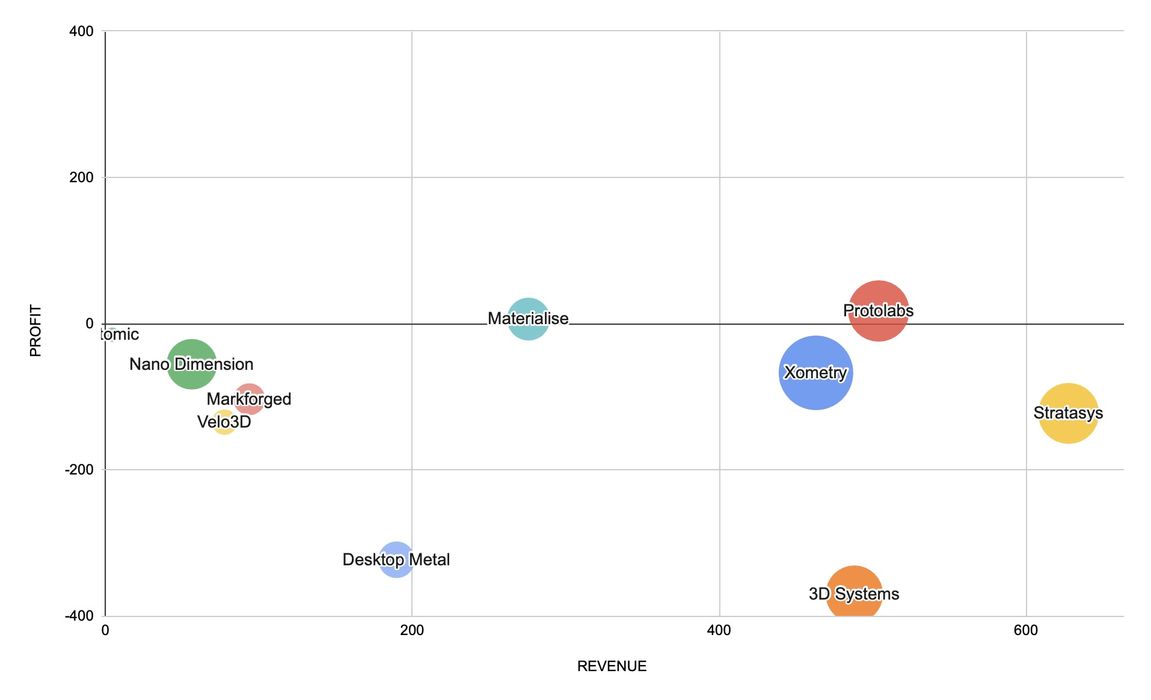
I decided to make a chart of the profit and size of each of the current top ten companies on our leaderboard so that we can visualize their relative strengths. To make it a fair comparison, I used financials from each company’s 2023 annual report — in other words, how they did in 2023. Their fortunes have no doubt changed somewhat in 2024, which is still in progress.
In the chart at top the horizontal axis is company annual revenue, the same information provided by Lansard. The vertical axis is their net profit for 2023. The bubble size is their market capitalization (the total value of all of the company’s shares) as of end of December 2023, the same point as their annual report.
What can we see? Plenty!
Four companies dominate the revenue, Protolabs, Xometry, 3D Systems and Stratasys. This is not so surprising because 3D Systems and Stratasys are the oldest companies and have had a long time to build up their business operations. The other two, Protolabs and Xometry, are both riding high on the manufacturing network business model.
Notice that almost all of the companies are below the $0 profit line. Yes, they are losing money, and sometimes a great deal of money. For example, Stratasys raked in US$627M in revenue, but still lost US$123M (meaning they spent US$750M).
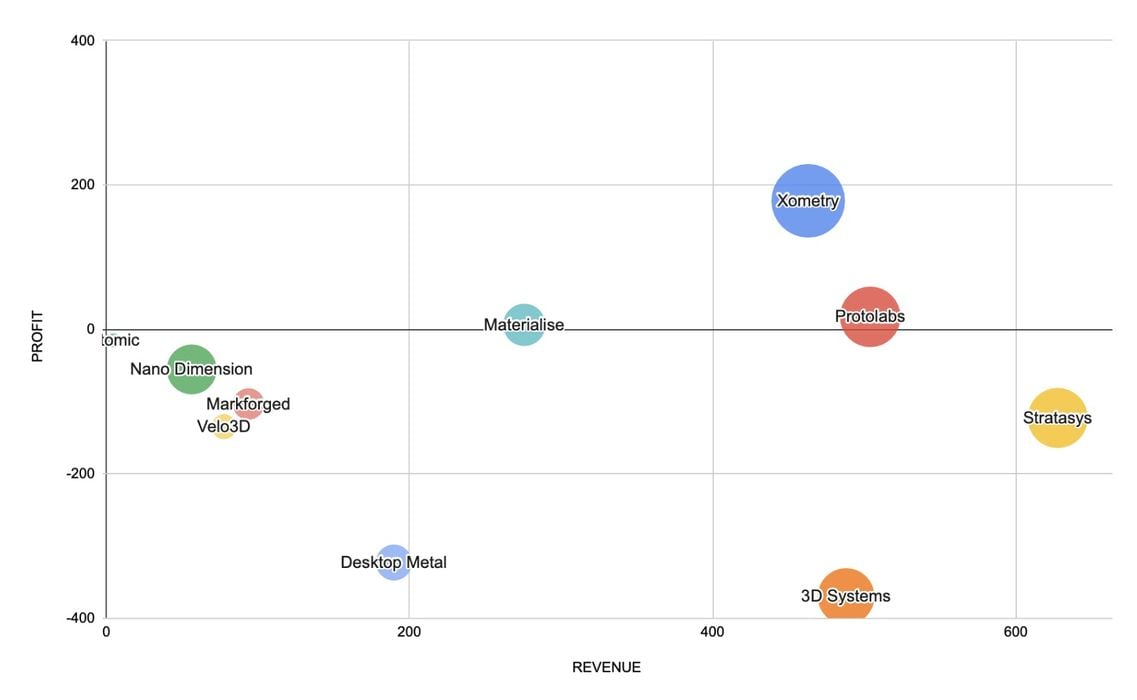
[UPDATE] A reader pointed out one of our numbers was suspicious, and they were correct: a previous version of this post had Xometry’s profit higher than it should have been as we had mistakenly used their gross profit figure instead of net profit. The chart has been corrected accordingly.
Protolabs made US$17M on US$504M revenue, about a three percent profit margin, but most companies are not in the black, at least for 2023, the year from which these results were collected from company annual reports.
The bubble size represents the market valuation of the company. Notice that the bubbles tend to get smaller as we look to the left, where revenue decreases.
But there’s one aberration: Nano Dimension seems quite a bit larger as compared to its neighbors. This is because that company just happens to have a very large cash reserve, which pumps up their valuation: your bank account also counts towards your total value.
Overall it’s not a particularly pretty picture, and this is perhaps why investors have been shying away from 3D print companies in the past year: the companies generally are not particularly profitable.
Unfortunately we don’t have the financial information for many other companies in the space because they are privately held. Companies like EOS, BigRep, Formlabs, Carbon, Prusa Research, etc. are unknowns. We also can’t place conglomerates on the chart, like HP, GE, etc, because their other operations dwarf their 3D print activities.
Nevertheless, it’s quite interesting to see how these companies land on the chart.
Via LinkedIn

