
A new research paper proposes a method to use interplanetary space probe trajectories as a method to generate unique 3D printable designs.
I’ve seen many unusual approaches to develop 3D printable designs, but this one is out of this world — literally.
Why do this? It’s because 3D printers, unlike most manufacturing processes, are able to produce objects with almost any geometry. That opens up almost infinite possibilities, and creative minds will attempt to fill that void.
What are space probe trajectories? They are curved paths through space. According to Kepler’s second law of motion, objects travel around each other in elliptical paths with faster motion when closer in, and slower when further away.
An ellipse isn’t a particularly interesting shape for 3D printing, so what exactly are the researchers doing here? To understand this, you must visualize how MANY objects move in space.
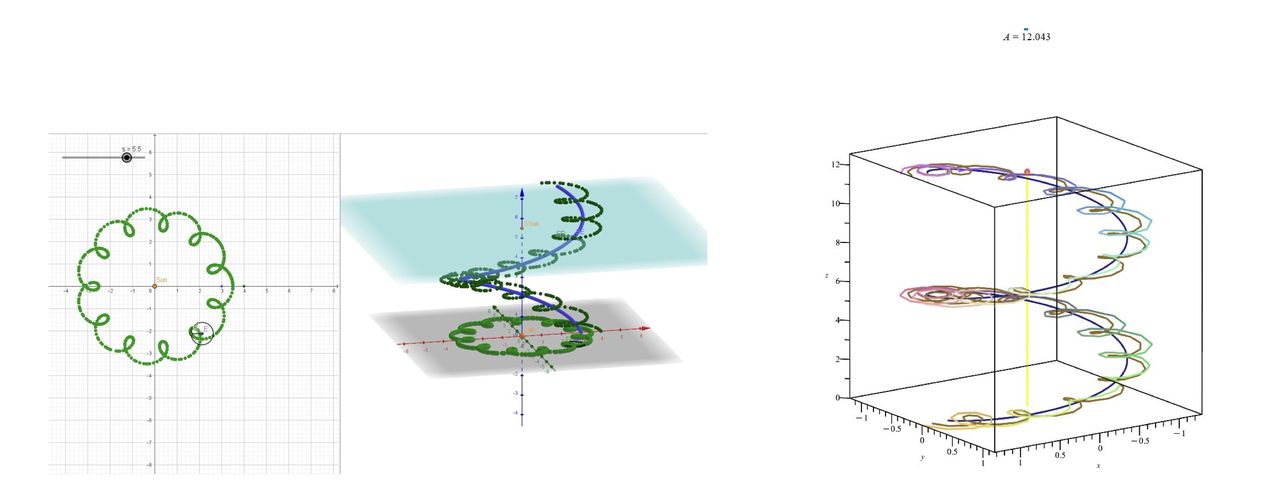
For example, the Moon travels around the Earth in an ellipse. But the Earth itself also travels around the Sun. And the Sun orbits around the galactic center. That’s three levels of motion. If you were to combine these together you’d see paths like this:
They use mathematics environments GeoGebra and Maple to create functions that replicate aspects of these complex space trajectories. Here is some sample code from their paper:
c1 := spacecurve([cos(t) + 1/5cos(12t), sin(t) + 1/5sin(12t), t],
t = 0 .. 4Pi, thickness = 3, labels = [x, y, z]): sun := plots[animate](spacecurve, [[0, 0, t], t = 0 .. A], A = 0 .. 4Pi,
thickness = 3, color = yellow)
sunplo := plots[animate](pointplot3d, [[0, 0, A]], A = 0 .. 4Pi, color = orange, symbol = sphere) planet := plots[animate](spacecurve, [[cos(t), sin(t), t], t = 0 .. A], A = 0 .. 4Pi, thickness = 3, color = navy)
sat := plots[animate](spacecurve, [[cos(t) + 1/5cos(12t), sin(t)
+ 1/5sin(12t), t], t = 0 .. A], A = 0 .. 4*Pi,
color = sienna, labels = [x, y, z]):
display(sun, planet, sat, sunplo)
Code like this is used to generate animations of the orbital movements, which can integrate colors to represent other factors, like time.
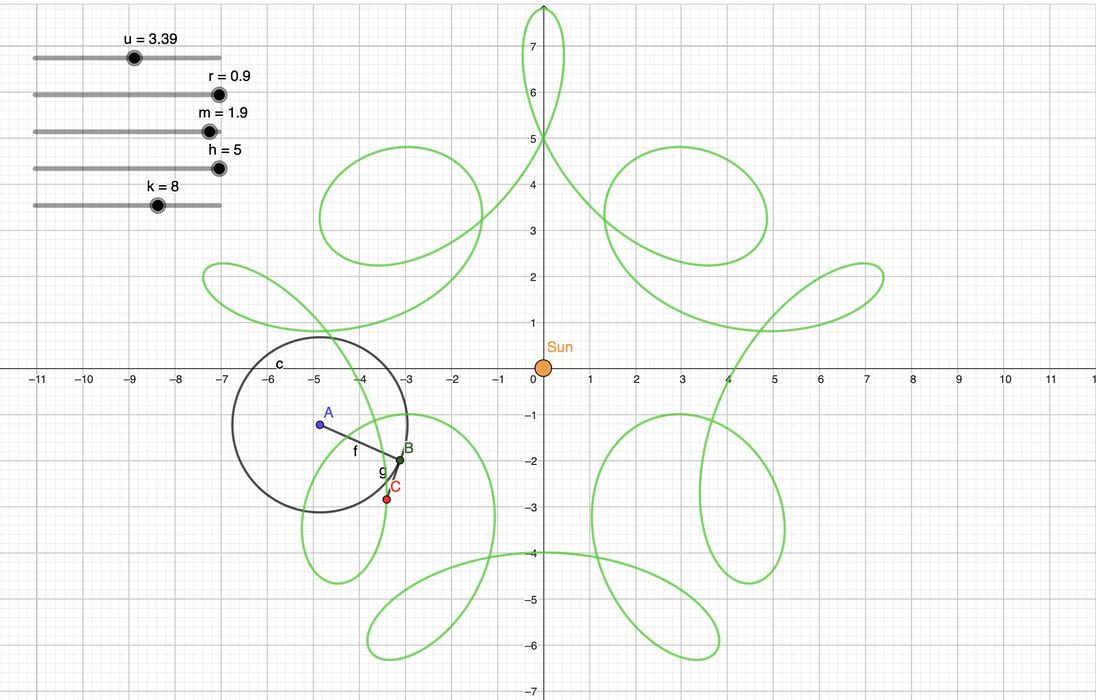
At top you can see a GeoGebra example of an implementation showing the path of an object around the Sun. This is a 2D representation, but it would be relatively easy to convert this to a 3D representation.
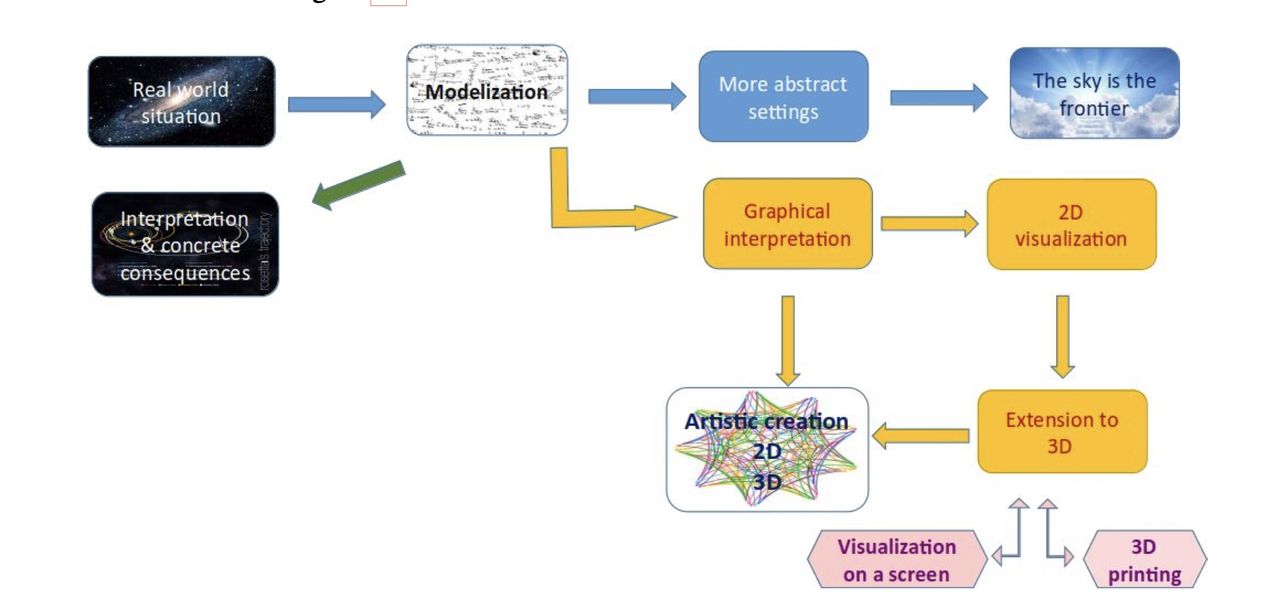
The researchers were able to use the above process to implement a variety of unusual patterns, which can lead to the possibility of some very unusual 3D prints.
Via ArXiv (PDF)